Utilizing key demographic and psychographic data representing area resident’s needs, wants, habits, and the like is a great way to glean insight into who your guest really is.
Demographic data is valuable in understanding geographic density and income levels, but combined with psychographic data and related research, demographic data can also help direct your menu offerings, pricing strategies, and services. As well as serve as a guiding principal for target marketing and outreach programs far more effectively than with just one of these data sets.
As the most recent U.S. consumer spending data was released by the National Restaurant Association (NRA) in 2009, their newly updated consumer spending report is crucial data for restaurant operators to utilize as a starting point when strategizing realistic, successful business plans. An excellent example of psychographic data can be found in the PRIZM data from Nielson.
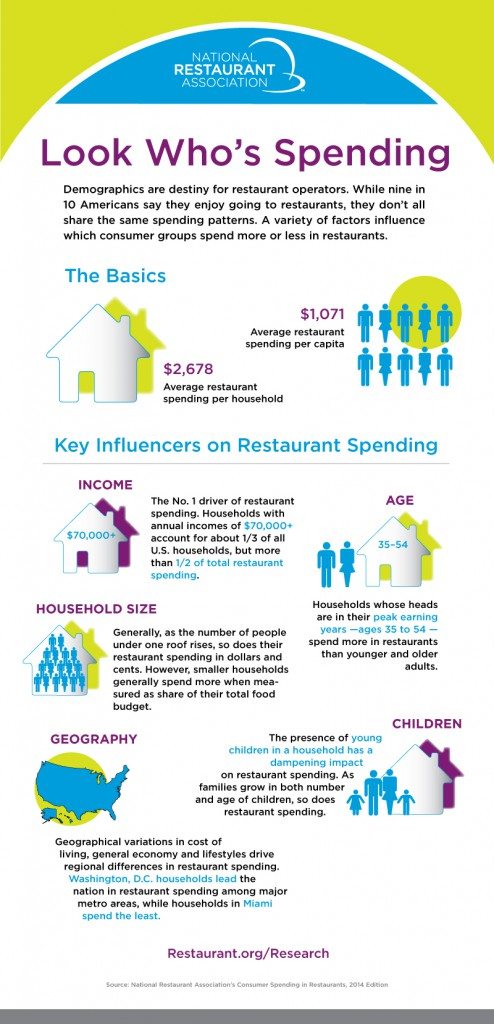
While the NRA reports that nine out of 10 Americans enjoy dining out, they do not share the same spending patterns. As a variety of factors influence consumer spending, uncovering “Who’s Spending, What, and Where?” is vital.
Some other U.S. consumer spending habits include:
- The primary influencers of restaurant spending: households with annual incomes above $70,000 account for about one-third of all U.S. households, but more than half of total restaurant spending
- As families grow, so does their restaurant spending
- Average annual restaurant spending per U.S. household: $2,678
- Great data for our VSAG team, as we’re based in DC: households in Washington, D.C. lead the nation in restaurant spending among major metro areas
For more information, go to VSAG restaurant business plans.