The folks at Trulia have crafted two heat maps illustrating the most restaurant-and bar-dense metro areas in the US. One correlation we noticed is that the metropolises along the coasts tend to be eating cities while those inland tend to be drinking cities.
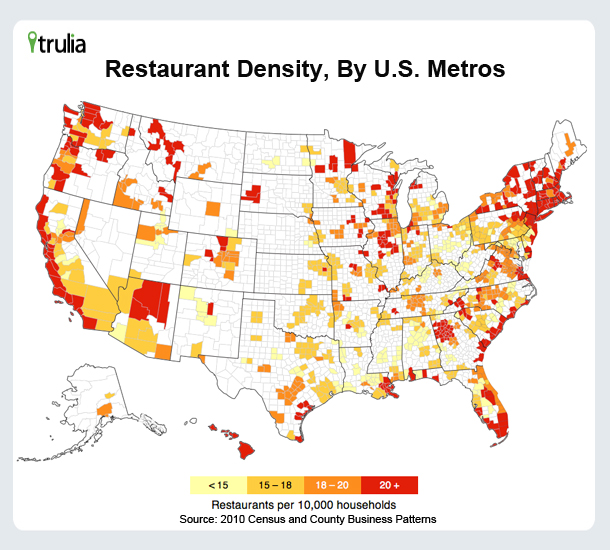
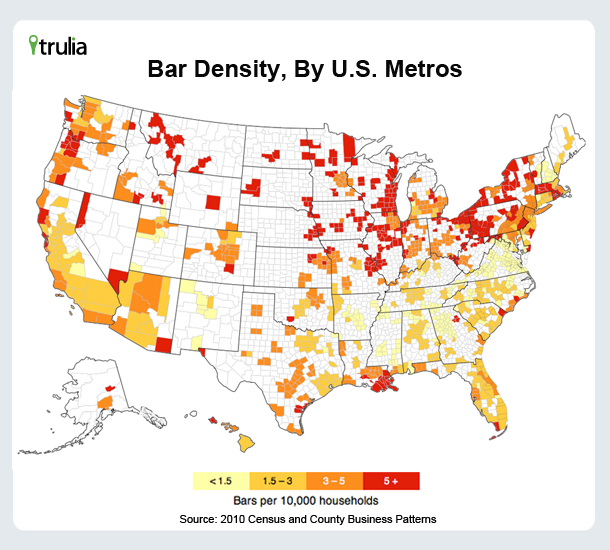
Another interesting correlation is the price of residential real estate: homes for sale in eating cities were sold for substantially more per square foot than those in drinking cities. As Trulia explains the phenomenon, “high-income people have more money to spend on eating out, so the high-cost places where high-income people tend to live can support more restaurants.”
Top Metros for Eating
|
# |
U.S. Metro |
Restaurants per 10,000 households |
Median price per sqft of for-sale homes |
|
1 |
39.3 |
$459 |
|
|
2 |
27.6 |
$222 |
|
|
3 |
26.5 |
$217 |
|
|
4 |
25.3 |
$275 |
|
|
5 |
24.9 |
$150 |
|
|
6 |
24.8 |
$319 |
|
|
7 |
24.8 |
$260 |
|
|
8 |
24.3 |
$146 |
|
|
9 |
24.2 |
$219 |
|
|
10 |
24.0 |
$129 |
Note: among the 100 largest metros.
Top Metros for Drinking
|
# |
U.S. Metro |
Bars per 10,000 households |
Median price per sqft of for-sale homes |
|
1 |
8.6 |
$99 |
|
|
2 |
8.5 |
$109 |
|
|
3 |
8.3 |
$79 |
|
|
4 |
7.9 |
$91 |
|
|
5 |
7.2 |
$71 |
|
|
6 |
7.0 |
$86 |
|
|
7 |
6.8 |
$91 |
|
|
8 |
6.0 |
$459 |
|
|
9 |
6.0 |
$69 |
|
|
10 |
5.9 |
$39 |
Note: among the 100 largest metros.
Where do you land on the map?